2.90:Reports
| ‼ |
WARNING OBSOLETE TECH DETECTED!! Reports were removed from Grooper in version 2021. The reporting functionality they produced was replaced by the "Stats" page in the Grooper web client in version 2023. |
Reports display information collected from various Grooper operations.
About
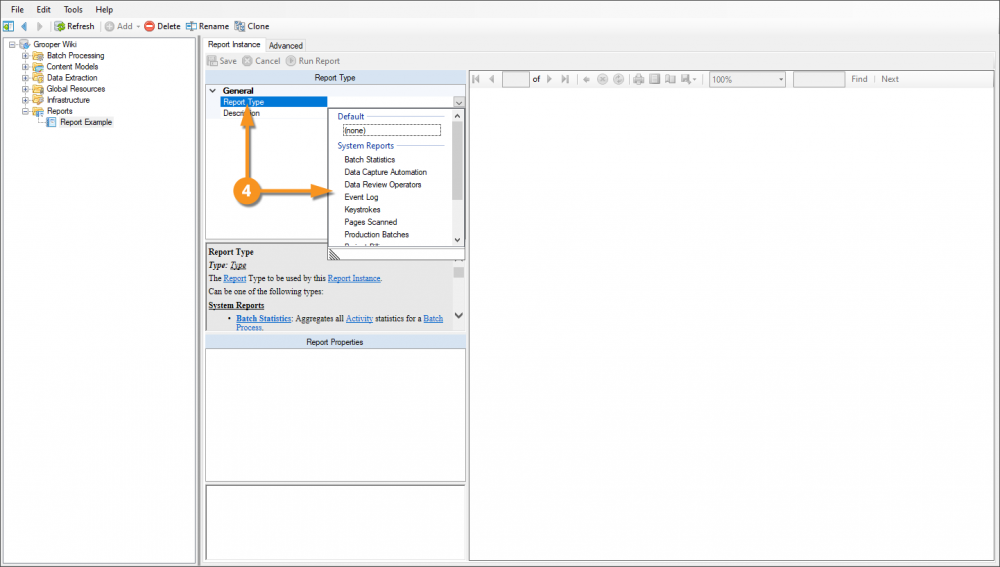
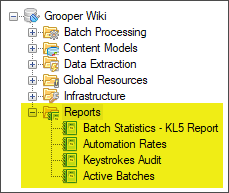
Individual Reports are created as Report Instances in Grooper. What information the Report Instance displays is defined by the Report Type property. There are several "System Reports" that ship with every Grooper install. Many of these are designed to track batch processing automation rates or the productivity of data entry clerks. For example, the "Keystrokes" report tracks the number of keystrokes logged during Data Review for Batches using a specified Batch Process.
There are twelve System Reports that are included in every Grooper installation.
- Batch Statistics
- Data Capture Automation
- Data Review Operators
- Event Log
- Keystrokes
- Pages Scanned
- Production Batches
- Project Billing
- Query Report
- Scan Operator Efficiency
- Scan Volume
- System Health
Each of these reports can be saved as a Word, PDF or Excel file.
Custom reports can also be generated in an Object Library using Microsoft Visual Studio and the Visual Studio Report Designer.
Report Types
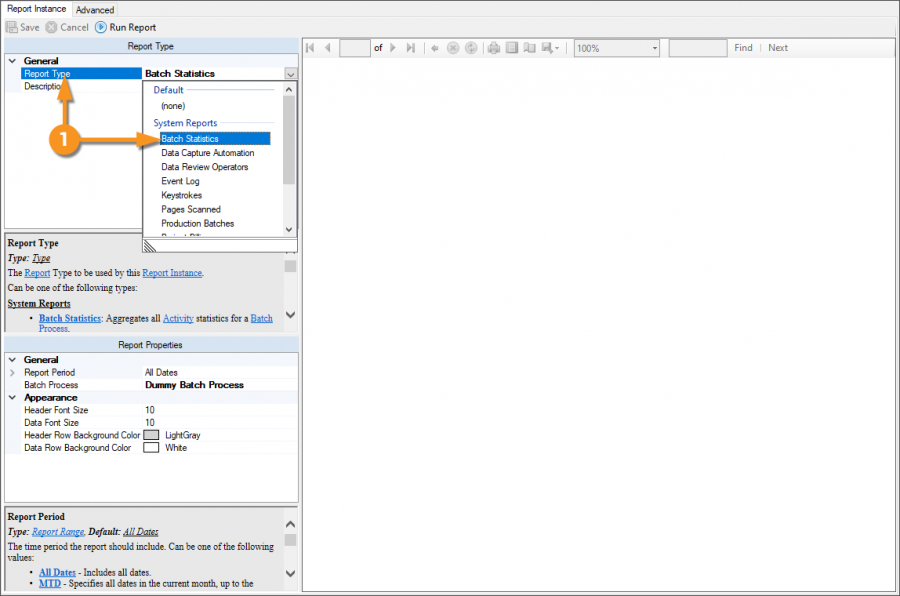
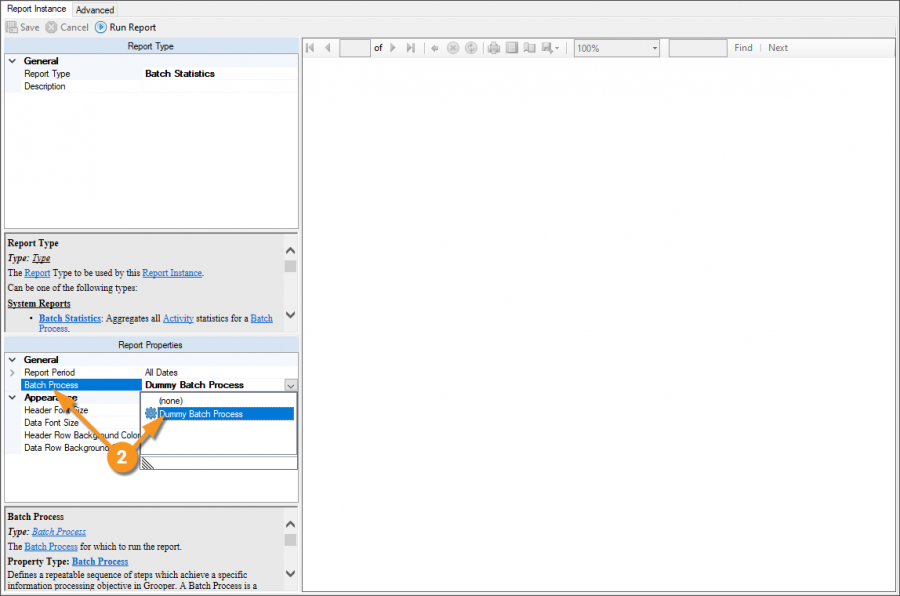
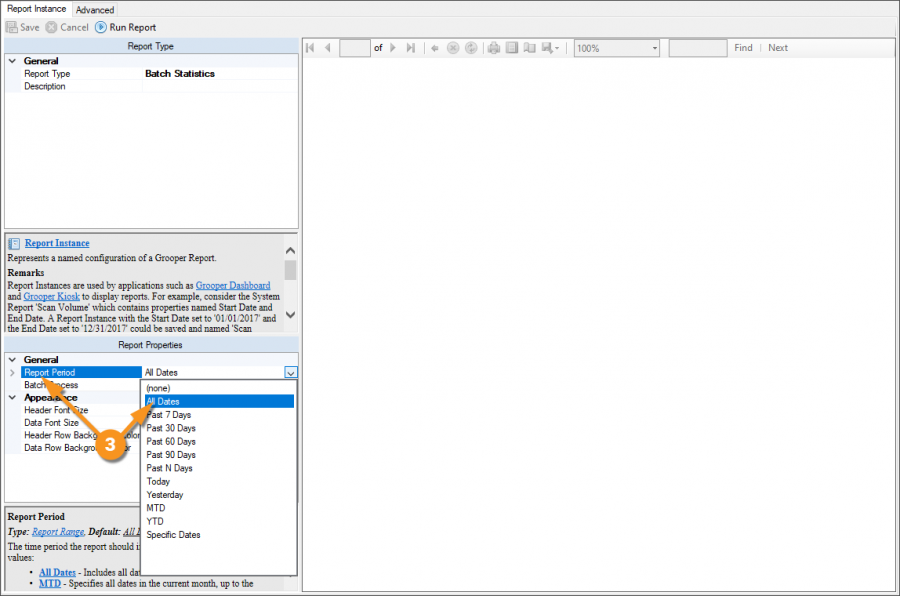
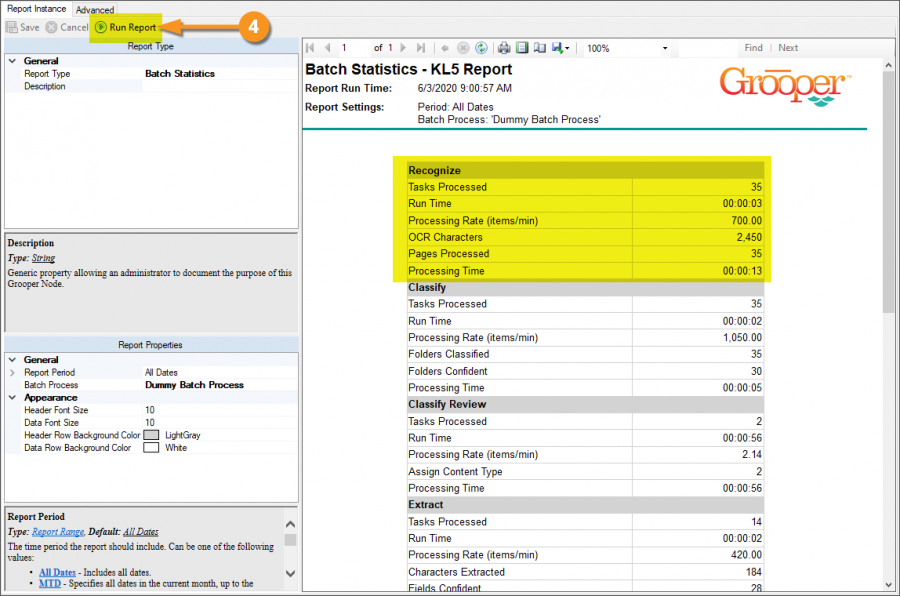
The Batch Statistics report details information about each Activity in a Batch Process. This report will give different information, depending on the activity steps in the Batch Process fro a given date range. You can use this information to get a better idea of how good your accuracy, productivity and automation rates are.
|
|
|
|
|
|
|
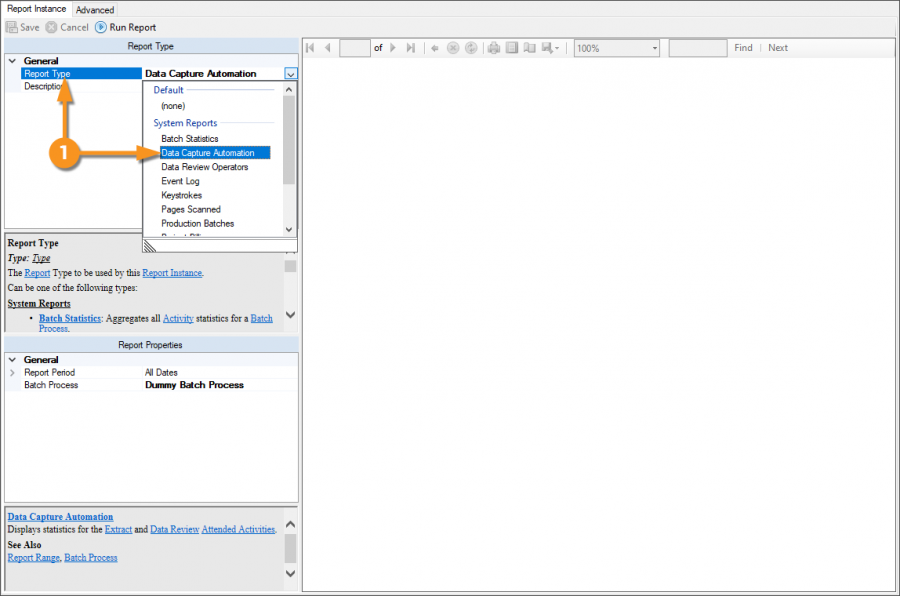
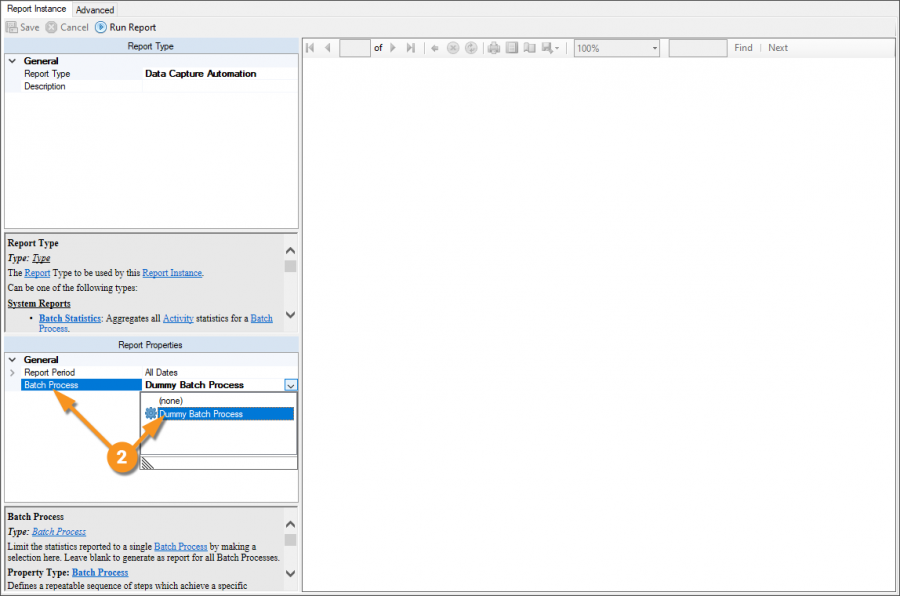
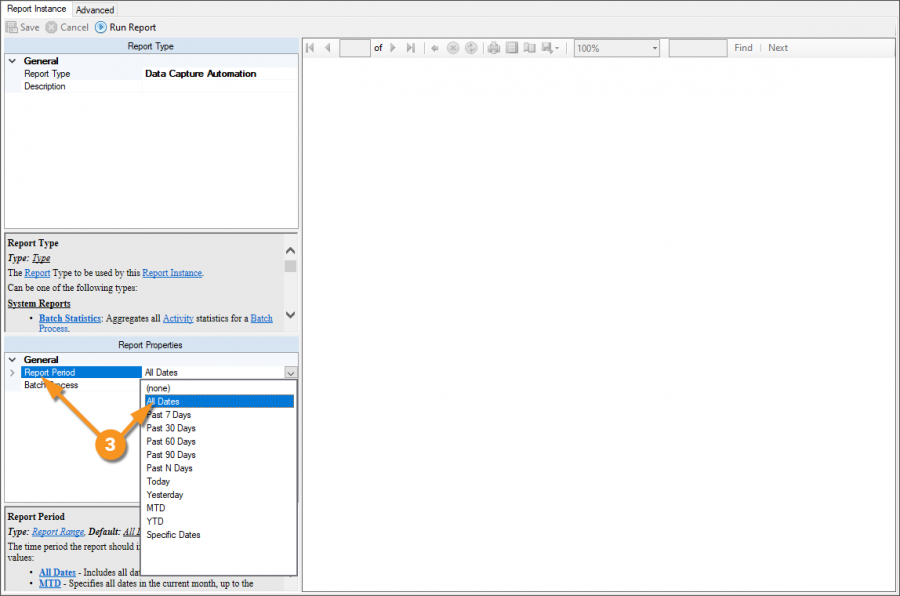
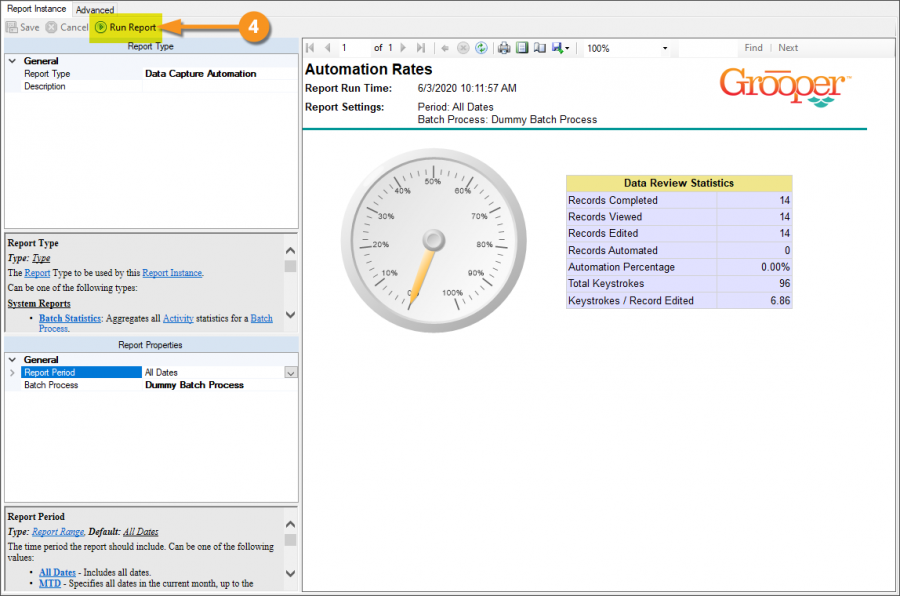
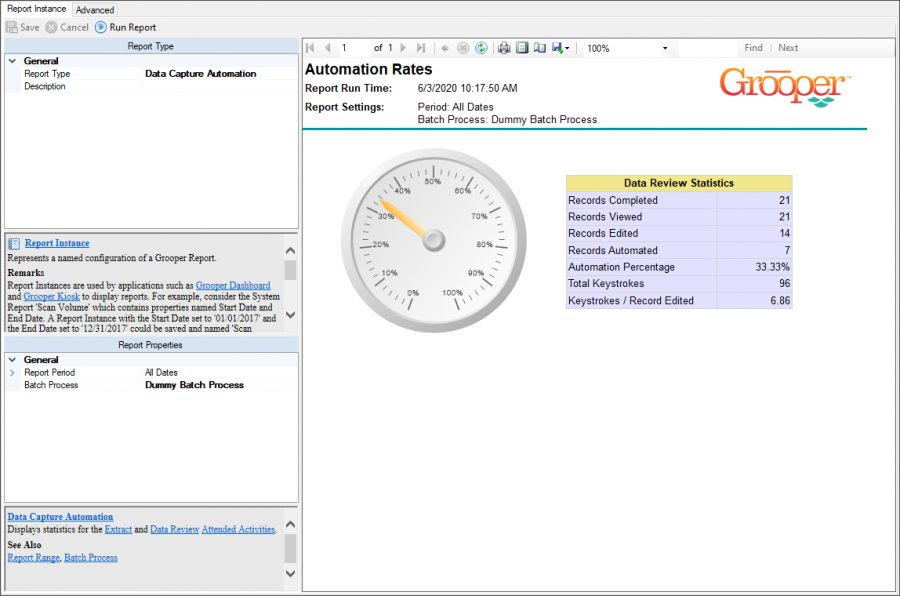
The Data Capture Automation report returns information from the Data Review activity. This includes total records completed for a Batch Process and total records edited. The percentage of records edited of records completed gives you an "Automation Percentage". If you don't have to edit any field, your data extraction is perfect and your automation rate would be 100%. The report also displays the total number of keystrokes and keystrokes per record.
|
|
|
|
|
|
|
|
|
How To
Create a New Report
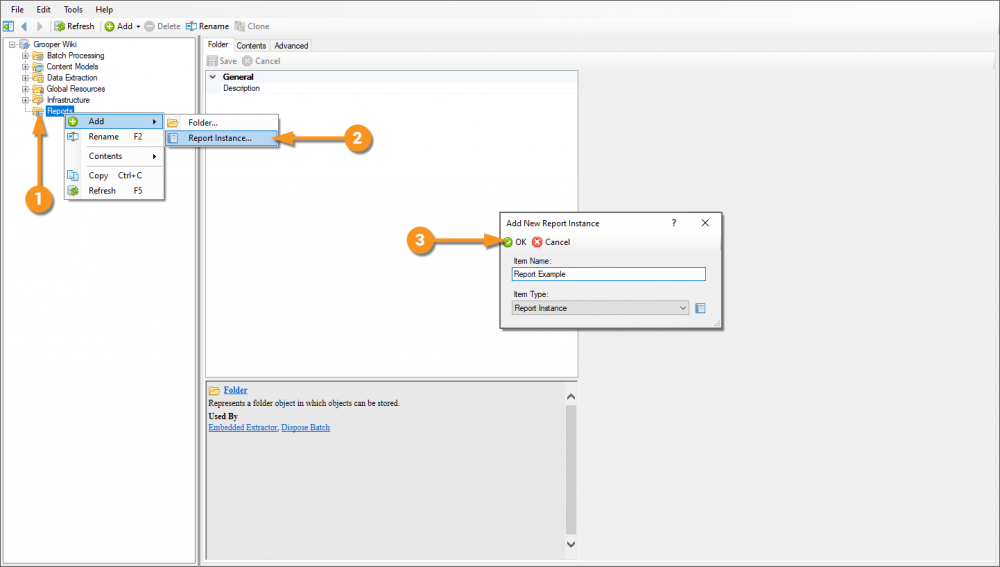
Add a New Report Instance
|
1. Right click the Reports folder in the Node Tree. 2. Select "Add" and "Report Instance..." 3. A pop up window will appear to name the Report Instance. Here, we chose to name it "Report Example". Press the "OK" button to add the Report Instance to the Reports folder. |
Using the Query Report to Generate Custom Reports
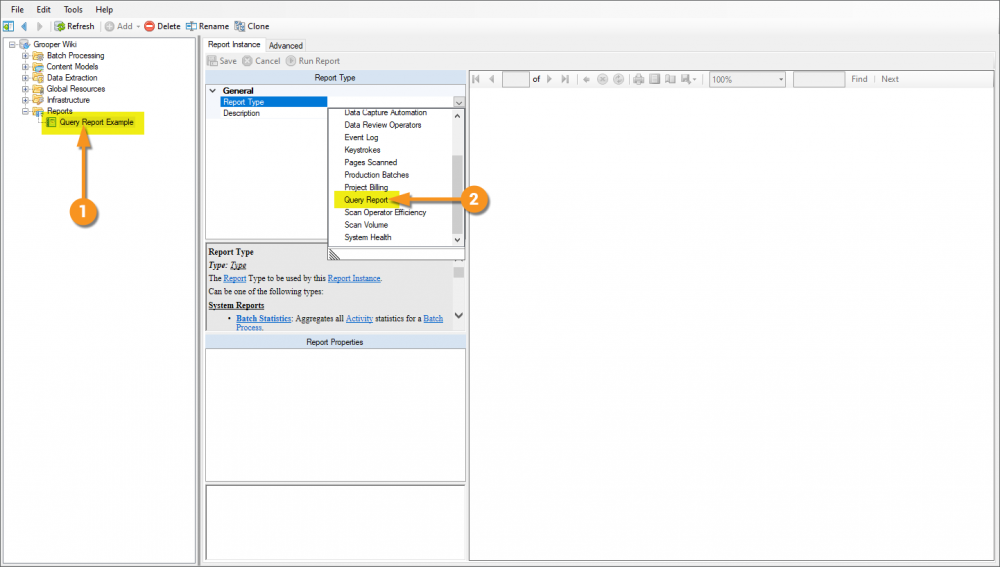
The Query Report allows you to perform a SQL query against any SQL database. This includes the ability to query the Grooper SQL database. If the information you want to is query-able in some way from the Grooper database tables, you can make a custom report targeting it!
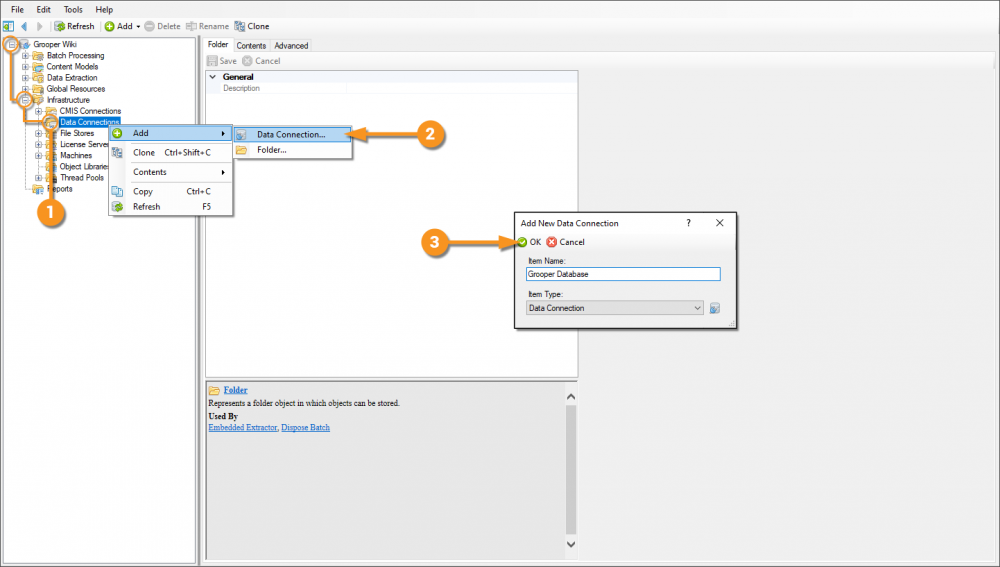
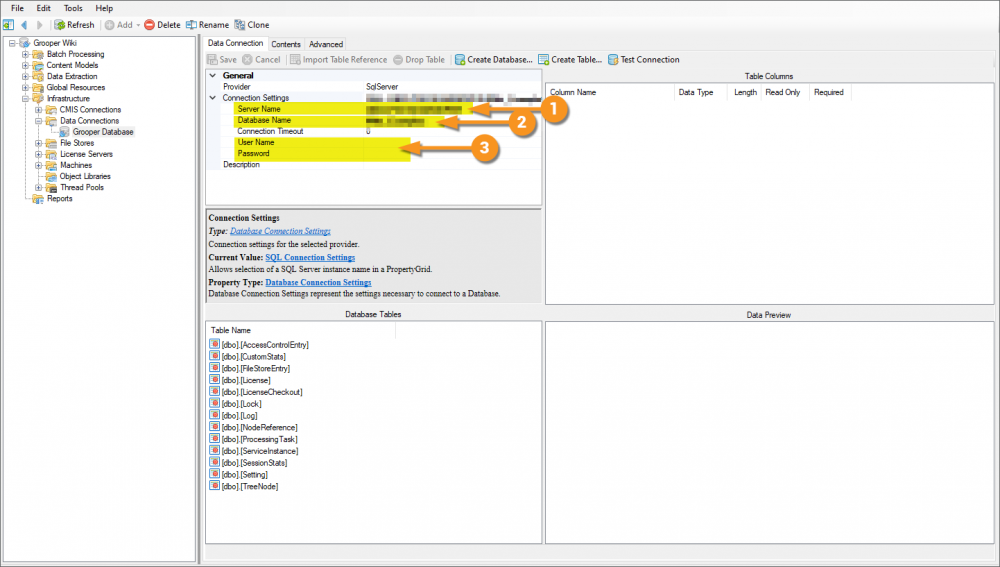
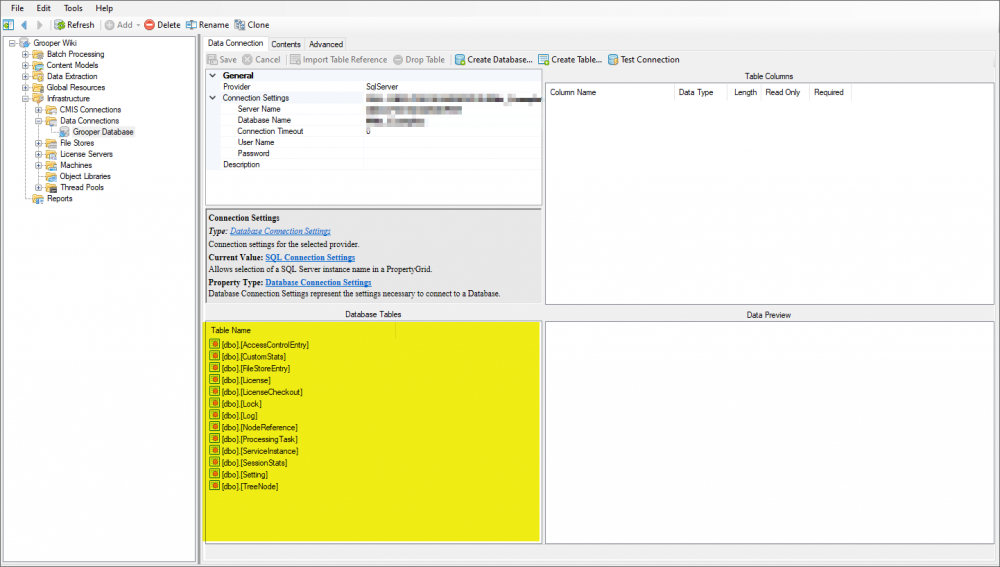
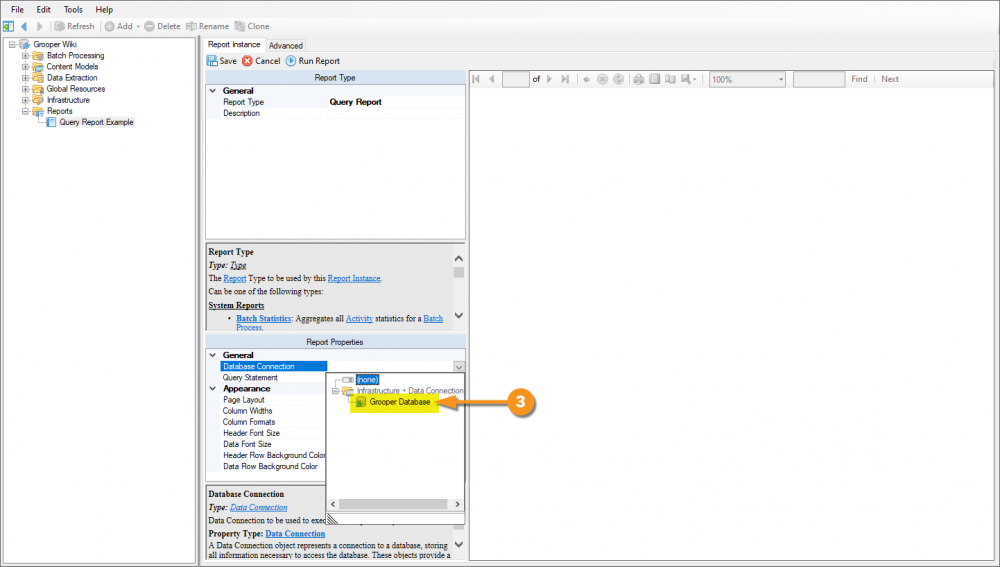
Create a Data Connection to the Grooper Database
|
Enter Database Connection Settigns
Add a New Query Report
|
|
|
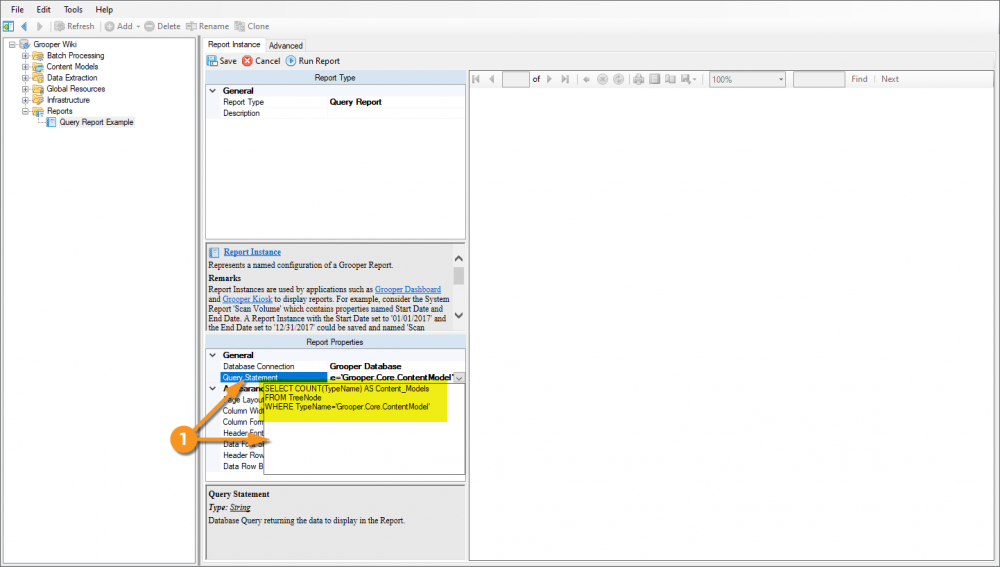
Next, you will use the Query Statement property to write a SQL query to return whatever information you desire from the Grooper Database. The next few tabs provide some examples of SQL queries and their results when the report runs.
Count Objects in a Repository
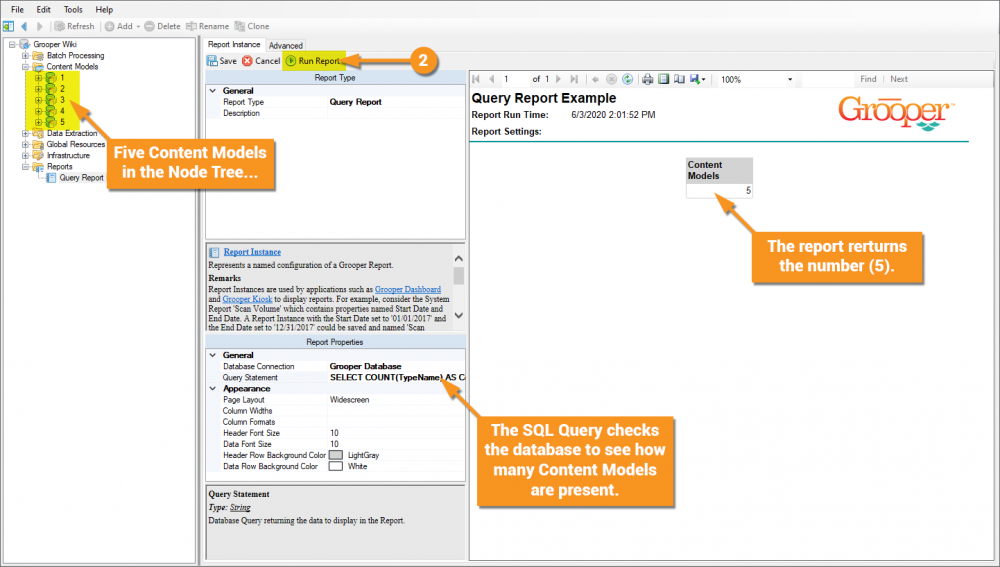
This is a simple query to return the number of Content Models in a Grooper Repository. The query is as follows:
SELECT COUNT(TypeName) AS Content_Models
FROM TreeNode
WHERE TypeName='Grooper.Core.ContentModel'
|
|
|
You could use this query to count any object in the repository. Just change the value in the WHERE TypeName='Grooper.Core.ContentModel' clause to match the Grooper Type Name of the object you're looking for. For example, if you wanted to return the count of Data Types you would instead use WHERE TypeName='Grooper.Core.DataType'
Count Multiple Types of Objects in a Repository
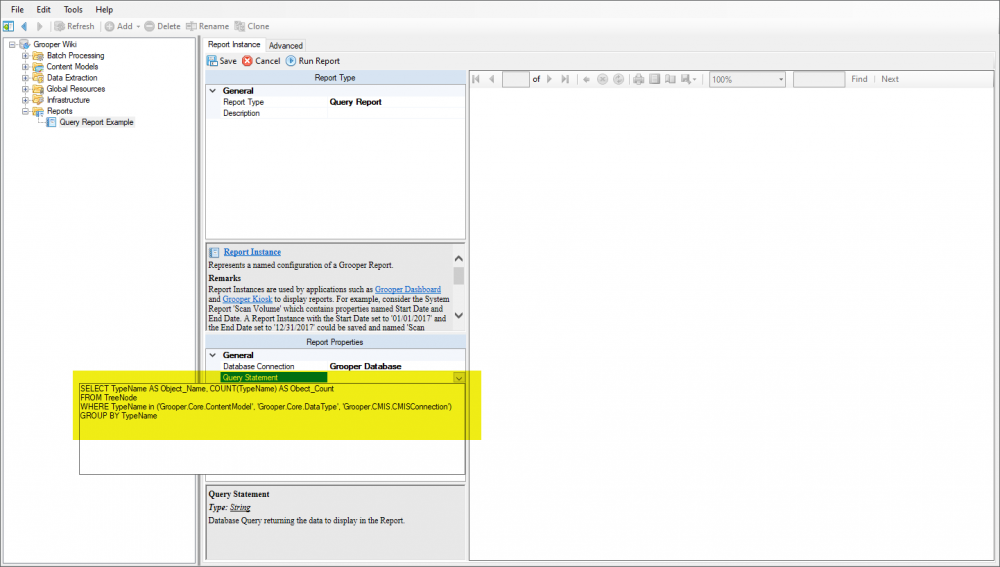
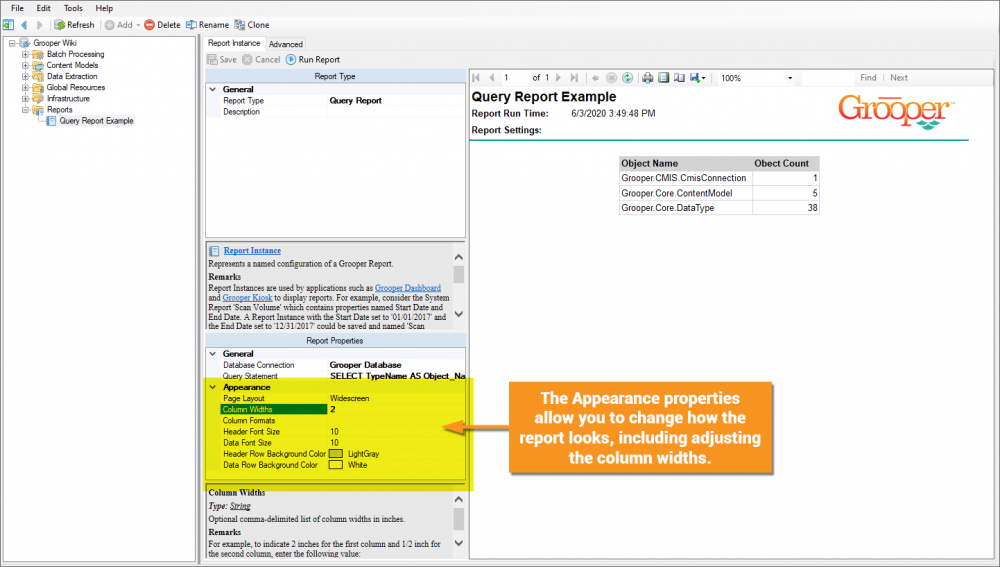
This query is very similar to the one from the previous example, but counts multiple different types of objects instead of just one. Specifically, this will return the number of Content Models, Data Types and CMIS Connections.
SELECT TypeName AS Object_Name, COUNT(TypeName) AS Obect_Count
FROM TreeNode
WHERE TypeName in ('Grooper.Core.ContentModel', 'Grooper.Core.DataType', 'Grooper.CMIS.CMISConnection')
GROUP BY TypeName
|
Just like in the previous example, enter the SQL query using the Query Statement property. The dropdown menu will allow you to type in the SQL query. |
|
|
When the report runs, it returns a count of the three types of objects searched for in the Node Tree.
|
Attended Activity Time Tracking
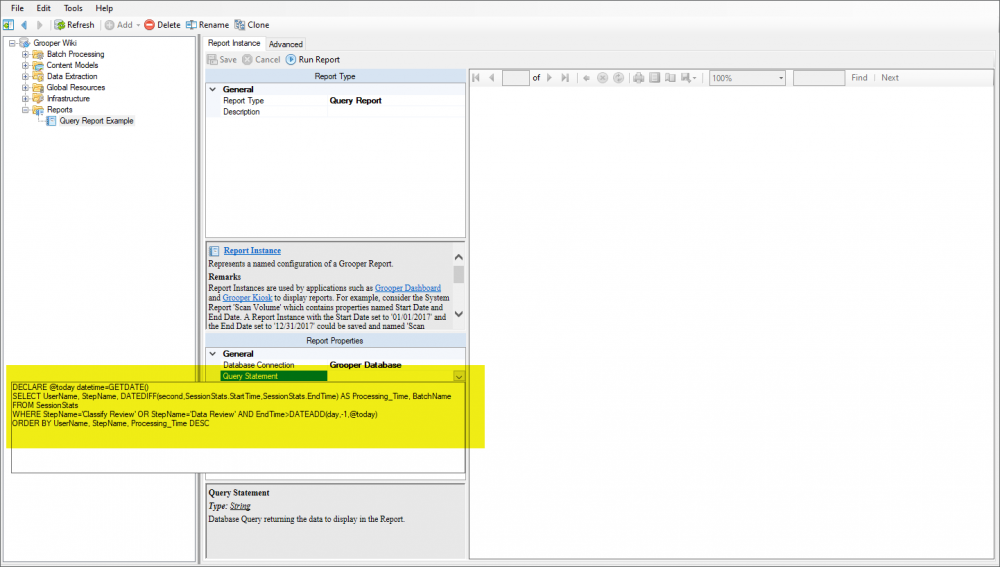
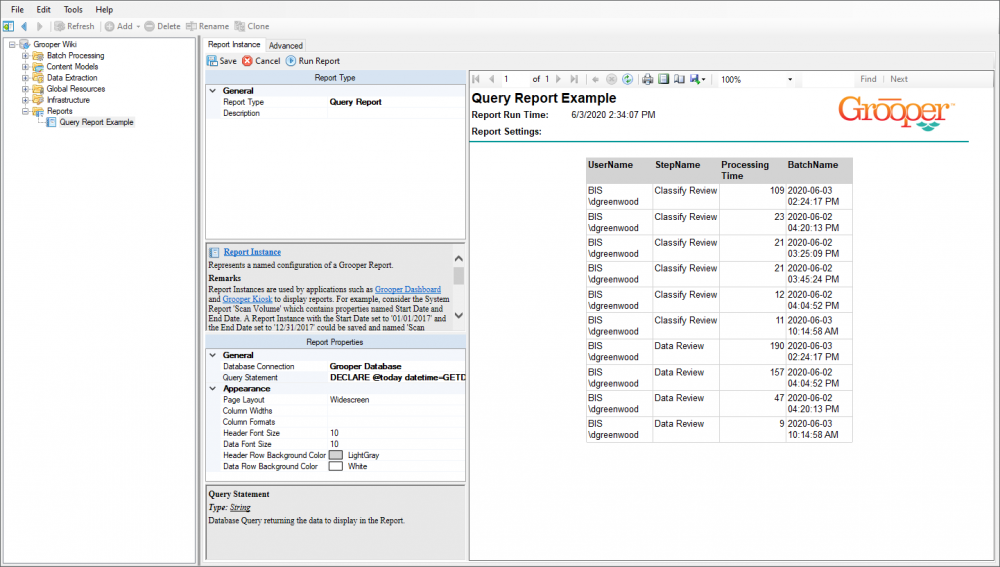
This query returns the time (in seconds) users have spent on the attended activities Classify Review and Data Review in the last day.
DECLARE @today datetime=GETDATE()
SELECT UserName, StepName, DATEDIFF(second,SessionStats.StartTime,SessionStats.EndTime) AS Processing_Time, BatchName
FROM SessionStats
WHERE StepName='Classify Review' OR StepName='Data Review' AND EndTime>DATEADD(day,-1,@today)
ORDER BY UserName, StepName, Processing_Time DESC
|
Just like in the previous example, enter the SQL query using the Query Statement property. The dropdown menu will allow you to type in the SQL query. |
|
|
When the report runs, it searches the "SessionStats" table, which collects the start and end time for Classify Review and Data Review activities from processed Batches and returns the total time spent for each instance. |
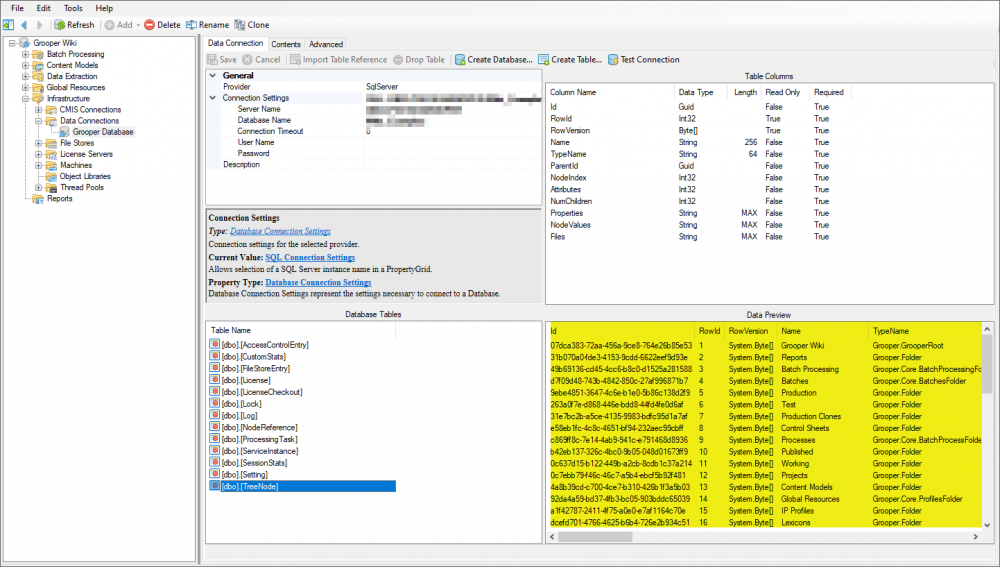
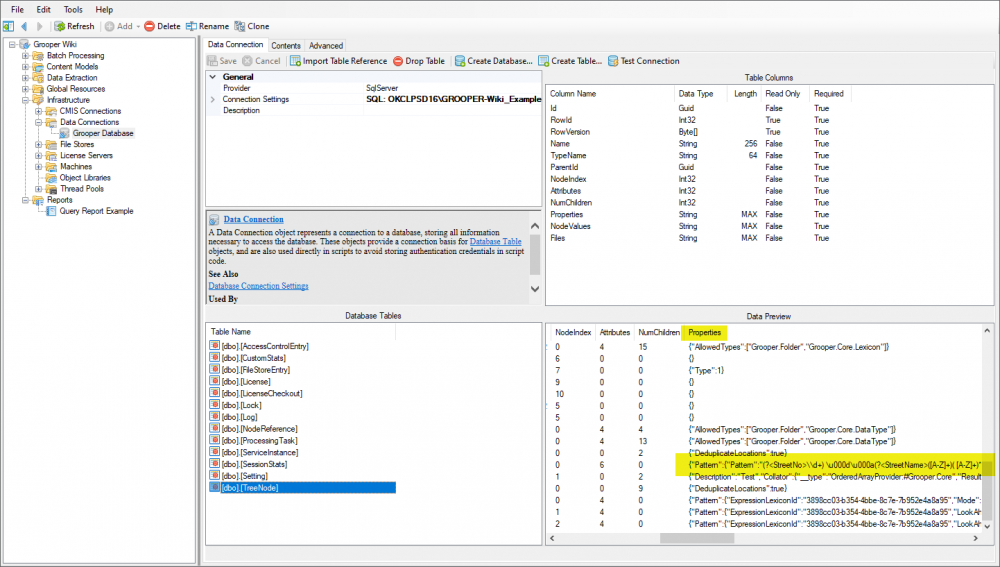
If you're really serious about using the Query Report to build custom reporting, you may want to explore the "TreeNode" table. This single table has the most information on every single object in your Grooper Environment. This includes the values of all properties on every object. You can even see the regular expression pattern used by extractor objects!
Version Differences
There are no notable version differences at this time.

